
Where are housing prices heading?
This article has been translated from Finnish with the help of automated translation. The Finnish original is the authoritative version.
A Finnish home is cheaper relative to wages than at any time in ten years. That is good news for a buyer, but it does not answer what most people are really asking: has the floor already been seen?

Illustration, produced with artificial intelligence
A turning point is not identified by opinion. We went through everything that might be imagined to anticipate the development of housing prices. We looked at which of them actually have a connection. Below are the result and our view for the coming year.
Here is the starting point
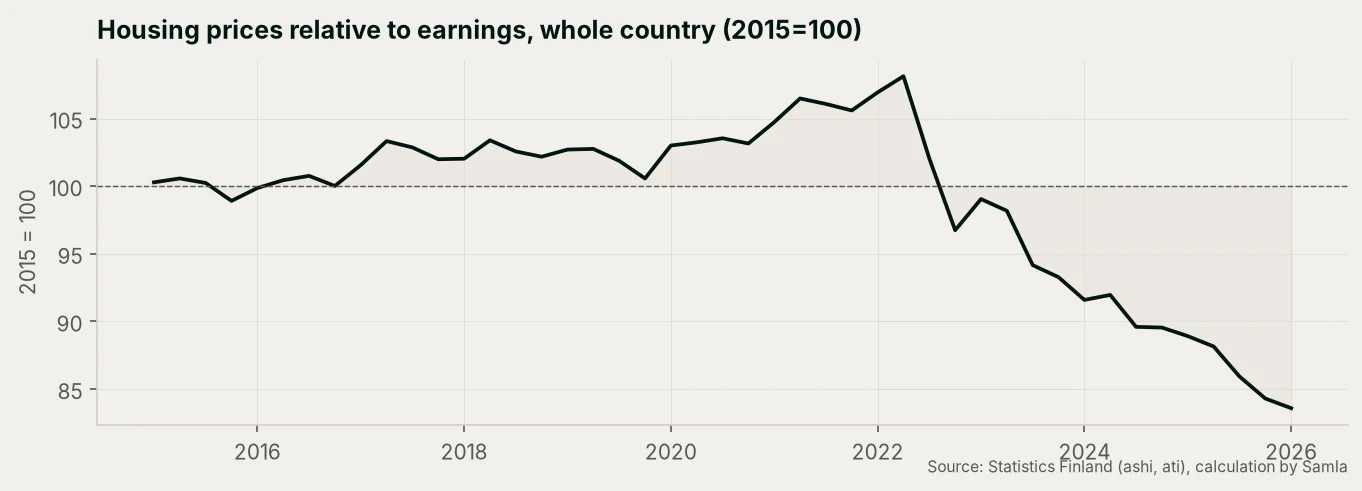
The curve shows how much homes cost relative to what people earn. At the 2015 starting point the figure is one hundred. In the summer of 2026 it is 84.
For the same salary you therefore get a home about a fifth larger today than ten years ago. The change has come from two directions at once. Prices have fallen since 2022, but an equal share of the difference comes from the fact that wages have risen.
For a professional investor the position is familiar. When properties can be bought more cheaply relative to what the tenant pays, the return improves from both ends. The question is not whether the starting position is good. It is exceptionally good. The question is what happens next.
Does history tell us anything?
Our research list included the interest rate level, unemployment, government debt, pension expenditure, bankruptcies, transaction volumes, housing starts and consumers' intentions to buy.
We compared them with prices, rents and transaction volumes. Not from the same moment, however, but by shifting the series in time: did unemployment change before prices, and if it did, how much earlier?
Noticing the lag in a change is the whole point of the exercise. If something moves consistently six months before prices, it can be followed and give a six-month head start. If it coincides with the same moment, it is only another way of looking at the same thing.
We made the calculation in all eight Nordic and Baltic countries: Finland, Sweden, Norway, Denmark, Iceland, Estonia, Latvia and Lithuania. The reason is that the history of one country does not show whether a connection is genuine or coincidence. Finland's euro era contains only one proper interest rate cycle, and one cycle cannot separate a lasting connection from chance. Eight countries and two eras show what one cannot: does the connection stay the same even when the market behaves exceptionally?
What we found
A job matters more than the interest rate on the loan. This was the clearest of the results. Unemployment explains the variation in prices better than the interest rate does. More importantly, it works in the same direction in a crisis as well. With the interest rate the direction reverses: in a collapse rates and prices fall at the same time. A fall in rates then looks like a buying opportunity even though the floor is still ahead.
The explanation is mundane. A bank looks first at whether the applicant has an income and only then at what the loan costs. Someone who has lost their job does not get a mortgage even if the rate were zero.
How this is known
The connection between unemployment and housing prices was measured in eight countries and separately in two eras, before and after the financial crisis. The connection is negative in all sixteen measurements, without exception.
A short interest rate series is also available for six countries, so in those it is possible to compare unemployment and the interest rate directly. Unemployment explains the variation in prices more than the interest rate does in every one of the six: in Latvia 55 per cent against 34, in Lithuania 52 against 47, in Estonia 44 against 32, in Denmark 31 against 1, in Finland 11 against 3 and in Sweden 8 against 3. Not in a majority, then, but in all of them.
One thing must be said about the interest rate series. The figure for Sweden and Denmark is the country's own rate. For the euro area countries it is the euro area rate, because during the euro era there is no separate national money market rate. For Estonia, Latvia and Lithuania the figure therefore also covers the years in which they still had their own currency. Latvia and Lithuania do have their own interest rate series for those years, but not at the maturity this comparison uses.
The figures vary by country because they also reflect how violently the market has swung. In the Baltics both prices and unemployment have moved a great deal, so the connection appears strong. In Finland and Sweden both have stayed within a narrow range, so the explanatory share remains low even though the direction is the same.
The high Baltic figures are mainly a product of the financial crisis. When the same explanatory shares are calculated only for the period after joining the euro, they fall to five per cent in Estonia, seven in Latvia and four in Lithuania. The order remains, that is, unemployment still explains more than the interest rate, but neither explains price development in calm times to any real degree.
In the Finnish data the size of the effect is this: when the unemployment rate rose by one percentage point, housing prices fell by an average of 1.1 per cent.
Rents behave the opposite way to what one would expect. Rising interest rates do not push rents down but support them. When owning becomes more expensive, some buyers stay in rented housing and demand grows precisely when transactions stall.
Sijoittajalle tämä on analyysin tärkein havainto: vuokrakassavirta on suojattu samalta ilmiöltä, joka painaa arvoja. Suoja koskee hintojen laskua, ei kulujen nousua: hoitokulut ovat viime vuosina nousseet vuokria nopeammin, joten tuoton paraneminen on bruttovuokratuoton paranemista, ja hoitokulujen jälkeen käteen jäävä osuus on kasvanut vähemmän.
How this is known
In the Finnish quarterly data a one percentage point rise in interest rates raised rents by an average of 0.15 per cent three quarters later. The same rise lowered housing prices by 1.2 per cent with the same lag. The effect is therefore in the opposite direction.
Bankruptcies signal a turn before the unemployment figure does. This is because a company fails before its staff appear in the unemployment statistics. In the case of an entrepreneur it may never appear there at all. Finland has some 200,000 sole entrepreneurs whose ability to obtain a loan disappears in a bankruptcy just as it does for an employee who is made redundant.
For an investor this is the fastest warning sign available. The bankruptcy figure is updated monthly, whereas the unemployment figure comes with a delay.
How this is known
Without bankruptcies the model explains 30 per cent of the annual variation in prices; including bankruptcies, 43. The addition comes on top of unemployment rather than in place of it, that is, bankruptcies measure something the unemployment rate does not. A change in bankruptcies precedes a change in unemployment by three to six quarters. Bankruptcies over the past year concerned 14,241 person-years of work and there were 4,007 of them, so the average failed company represents 3.6 person-years.
Supply for 2027 and 2028 has already been decided. Housing starts over the past year numbered 15,748. This is close to the floor of the entire measurement history. The delay in a construction project from start to completion is one and a half to two years. That is why we already know in advance how many homes will be completed over the coming two years or so.
What we expect
Homes are now cheaper relative to wages than at any time in twenty years. Even so, our view for the next twelve months is that prices will stay flat or fall slightly. The decline will ease, but it will not turn into a rise during this period. Rents, too, are almost standing still, and their rise will begin only when the shortfall in completions starts to bite.
| Year | Housing prices | Rents, non-subsidised | Status |
|---|---|---|---|
| 2024 | −3,1 % | +1.4% | actual |
| 2025 | −2,3 % | +0.1% | actual |
| 2026 | about −2.5% | +0.1% | start of the year actual |
| 2027 | −1…+1 % | +1…+2 % | forecast |
| 2028 | +2…+4 % | +2…+3,5 % | forecast |
The table ends in 2028 deliberately. Until then supply has already been decided, because the starts have been made and completions follow from them. After that, developments depend on when construction restarts, and nobody knows that. The direction is nevertheless the same: the shortage unwinds slowly and upward pressure on rents continues for longer than on prices.
Two things follow from this.
The first is timing. In this view a turn in prices is not a matter for next year, but the supply shortage is. When completions fall at the same time as the population of the growth centres rises, the pressure falls first on rents and only then on prices. The buyer's market is therefore open for longer than the tenant's.
The second is what decides the matter for an investor. The view on prices is uncertain and we say so directly. The view on rents is clearly firmer and it is positive in every path we have calculated. An investor whose return comes from cash flow rather than from capital appreciation can withstand a slight fall in prices without it touching the return. That same investor can today buy properties at prices that, relative to rents and wages, are the cheapest in ten years.
How this is known
The price figure in the annual table is the index of all dwellings that Statistics Finland reports to Eurostat. The index for existing flats, which is used in the market review, has fallen somewhat more steeply and in June was 3.9 per cent lower than a year earlier.
The model behind the forecast explains about a third of the annual variation in prices, so the figures are ranges rather than points. The 2028 figure rests on the supply pipeline and the interest rate path. Its uncertainty is clearly greater than that of the nearer years.
Where will the turn show first?
While carrying out the statistical analysis we noticed that transaction volumes are worth following closely. In the Estonian data a recovery in transactions preceded the turn in prices by about a year and a half. In Finland transaction volumes began to fall at the start of 2026. When they turn back upwards in two consecutive quarters, that is the first reliable sign that the view in this article is becoming outdated.
We will say so then.
Disclaimer
This article is market commentary. It is not investment advice or an investment recommendation, and it is not the marketing or sale of alternative investment funds within the meaning of the Act on Alternative Investment Fund Managers. The article is not an offer or an invitation to subscribe for, buy or sell any financial instrument.
The article is based on public statistical sources and on Samla Capital's own market monitoring. The information has been compiled carefully and the figures have been checked against their sources, but their accuracy is not guaranteed.
The views presented are the author's assessments at the time of writing and may change without separate notice. Past performance is no guarantee of future performance, and the assessments presented are not promises or guarantees. Investment activity always involves the risk of losing the capital invested. Investment decisions should be made on the basis of your own objectives and financial situation, using a specialist where necessary.